

It is the last day of the month and you have 3 tabs open. Meta says the ads did brilliantly. Google says they did even better. Shopify, where the money lands, says something smaller.
You want to spend more on what works, and you do not know which tab to believe.
MER (marketing efficiency ratio) is your total sales divided by your total marketing spend. It uses your real sales, not what each platform claims.
MER = total sales ÷ total marketing spend
Why the 3 tabs disagree
You spent £25,000 on Meta and £15,000 on Google. Meta says 6.4×, so £160,000. Google says 8×, so £120,000. Together they claim £280,000. Shopify says £190,000.
A shopper saw a Meta ad on Monday, clicked a Google ad on Wednesday and bought on Thursday. Both platforms counted the sale. Nobody is lying.
MER cannot double count, because it starts from the money that came in:
The platforms together claim 7.0. The real figure is 4.75.
Find your floor
Before you ask what a good MER is, find how low it can go before you lose money. That is your floor. Below it, every sale loses money once the ads are paid.
It comes from the costs that rise with every sale: product, shipping and packing, payment fees, returns. Take what is left of each order after those. Divide your sales per order by it.
Here is one order, followed from the till to the floor:
Every £1 you put into marketing has to bring back £2.00 of sales just to break even.
Now try your own. Move the sliders:
Try it with your numbers
Your MER floor
Where each order goes
- Product
- Shipping
- Fees
- Returns
- Left for marketing
Left for marketing: £ an order
Aim for ×, 20 to 30% above the floor.
Add your fixed costs (monthly view)
Staff, rent and software don't rise with each sale, so they stay out of the floor. To see the MER you need to cover them too in a month, add them here.
To cover fixed costs as well, this month needs an MER of ×.
Staff, rent and software stay out of the floor. They do not change whether you sell 100 or 1,000. Check them in the calculator’s monthly view: did this month’s sales cover the ads and the fixed costs?
Set your target
Aim 20 to 30% above the floor, to leave room for a bad week, a dearer month on Meta or a sale. A floor of 2.0× gives a target of 2.4× to 2.6×.
- MER close to the floor: one soft week becomes a cash problem.
- MER far above the target: you can probably spend more and grow.
A good channel often gets switched off because the test was too small. Make yours big enough to be fair.
Track it in 4 columns
Once a month, fill in:
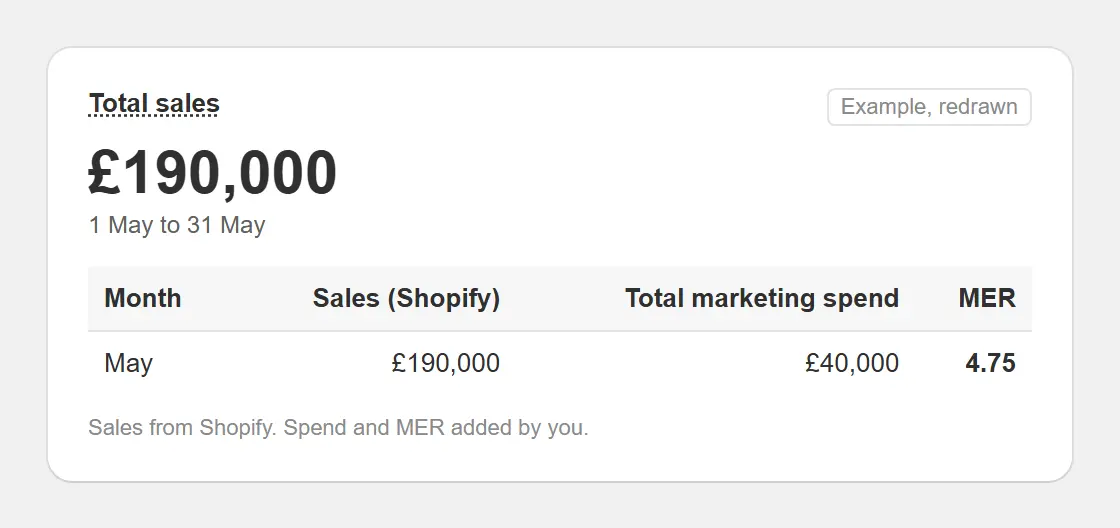
Count every channel in the spend: Meta, Google, TikTok, Amazon, affiliates and influencers. If you also sell wholesale or in shops, count only online sales.
Which number for which job
- MER for the big calls: spend more or less in total, keep a new channel or drop it.
- Platform ROAS for the small calls inside one platform: which campaign, ad or audience to back.
The costly mistake is using platform ROAS for the big calls.
Related reading
- Break-even ROAS: the same floor, worked out for a single channel
- Platform ROAS is a lie and Blended ROAS explained: why the dashboards disagree
- Easier Ads Budgeting: how much a new channel needs to spend for a fair test
Discounts, late returns and double-counted orders hide your real margin. Let's look at yours, free.
We set MER up as a standing report in our tracking and reporting service.
Is your MER telling a different story from your dashboards? Book a free call and we’ll read the numbers with you.
Quick answers
What is MER in ecommerce?
MER (marketing efficiency ratio) is your total sales divided by your total marketing spend, across every channel. If you sold £190,000 and spent £40,000 on marketing, your MER is 4.75.
How is MER different from ROAS?
ROAS is reported by each ad platform for its own campaigns, and each platform claims as many sales as it can. MER uses your real sales from Shopify or your till, against all your marketing spend, so the platforms can't double count.
What is a good MER?
There is no single good number. It depends on your costs. Work out your MER floor first: your sales per order divided by what is left after the costs that come with every sale (product, shipping, payment fees and returns). A healthy target is 20 to 30% above that floor.
Should fixed costs like staff go into the MER floor?
No. The floor uses only costs that rise with every sale. Staff, rent and software stay the same whether you sell 100 or 1,000, so look at them separately, as a monthly check that your total sales also cover them.
How often should I check MER?
Weekly to spot problems, monthly to make decisions. One week can swing with a sale or a stock problem, so judge budgets on the monthly figure.